RAPPORT DE RÉFÉRENCE
Revenue Growth Management (RGM) for CPG/FMCG: Benchmark & Insights
The State of RGM for CPG/FMCG Brands
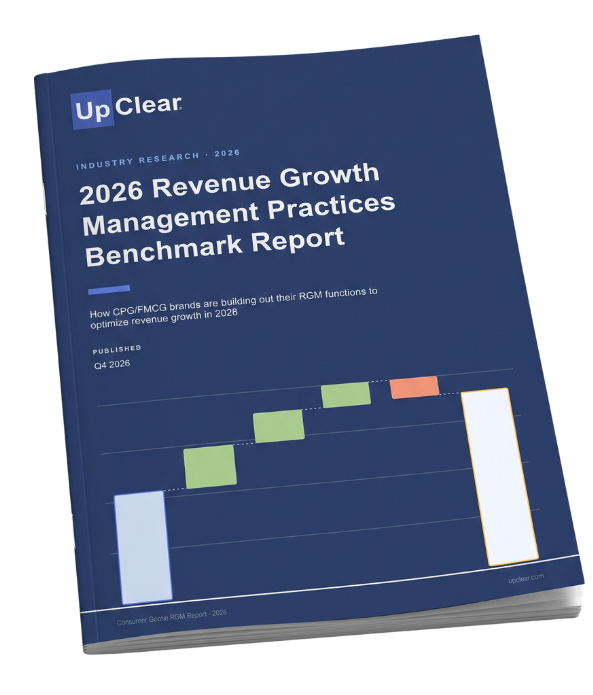
RGM sits at the center of pricing, pack, and promotion decisions, yet no two teams are built the same way. We surveyed RGM and trade leaders at CPG/FMCG brands on how their functions are structured, what they measure, and which tools and data they rely on. This report shows where teams stand today, what drives ROI, and where they plan to invest next.
How RGM Teams Function in 2026
RGM RESPONSIBILITIES - MULTI-SELECT (% OF PARTICIPANTS)
Promotion planning & optimization
96%
Pack / channel architecture
92%
Tarifs
88%
Post-event evaluation
77%
Trade terms & investment management
69%
Analytics / data science
65%
Customer & channel strategy
58%
Demand forecasting
31%
WHERE RGM PRIMARILY REPORTS - MULTI-SELECT (% OF PARTICIPANTS)
Ventes
54%
Finance
27%
General Management / Strategy
19%
Gestion des recettes
15%
Marketing
12%
Other
12%
KPIS USED BY RGM TEAMS - MULTI-SELECT (% OF PARTICIPANTS)
Gross margin
81%
Net revenue
81%
Volume / market share
65%
ROI / cost per incremental
54%
Trade spend efficiency
42%
Total profit
38%
Compliance to pricing & promo guidelines
15%
Working net sales
8%
Que contient-il ?
01
What Is RGM?
What falls under RGM, where teams report, how they work with other functions, and the KPIs they use to measure success.
02
How RGM Teams Are Performing
How teams rate their confidence in their people, processes, and tools, and the ROI they report.
03
What Drives ROI and Impact
What teams with the strongest results have in common, from process standardization to the tools they use.
04
Where RGM Is Going
The challenges holding teams back, the outcomes they expect, and how investment is changing.
05
Main Takeaways
Standout survey insights, from why teams trust their people more than their data to the impact of dedicated RGM tools.
06
What This Means for RGM
What the highest-impact teams have in common, and where RGM leaders can focus next as investment grows.
What’s Moving the Needle for High-Impact RGM Teams
📏 Standardize Your Processes
The most standardized teams reported ROI of 4.50 out of 5, compared with 2.83 for the least standardized.
🔁 Trust the Process
Teams with high process confidence rate their own effectiveness higher than confidence in their team or tools does. Process and speed aren’t a trade-off.
🎯 Invest in the Right Skills
Financial acumen, pricing and promotion analytics, and systems and tool expertise all tie to stronger results.
🛠️ Back It with a TPM System
Tool usage showed little relationship with ROI, with one exception. Teams using a TPM system report business impact of 3.73 out of 5, versus 2.55 for those without one.
Points clés
73%
of respondents expect RGM investment to increase
2.96
overall confidence in RGM decision-making (out of 5)
92%
of respondents use Excel in some part of RGM
+59%
improvement in business impact for the most standardized teams
Foire aux questions
Revenue Growth Management (RGM) is the discipline of coordinating a brand’s key commercial levers, including pricing, promotions, trade investment, pack architecture, and product mix. It aligns teams and manages trade-offs so that revenue and profit grow together rather than at each other’s expense.
Most often, Sales. Just over half of respondents (54%) report into it. Many teams report into more than one function, including Finance and General Management/Strategy for many. This mix of teams reflects how cross-functional RGM is.
RGM teams leverage a mix of KPIs to gauge success. Gross margin and net revenue lead, each used by 81% of respondents. Volume/market share (65%), ROI/cost per incremental (54%), trade spend efficiency (42%), and total profit (38%) follow. Fewer teams track compliance to pricing and promotion guidelines or working net sales.
UpClear's 2026 RGM Report is for RGM, trade, sales, and finance leaders at CPG/FMCG brands who want to see how peers structure their teams, measure success, and use tools and data. It also helps teams planning where to invest in RGM next.