

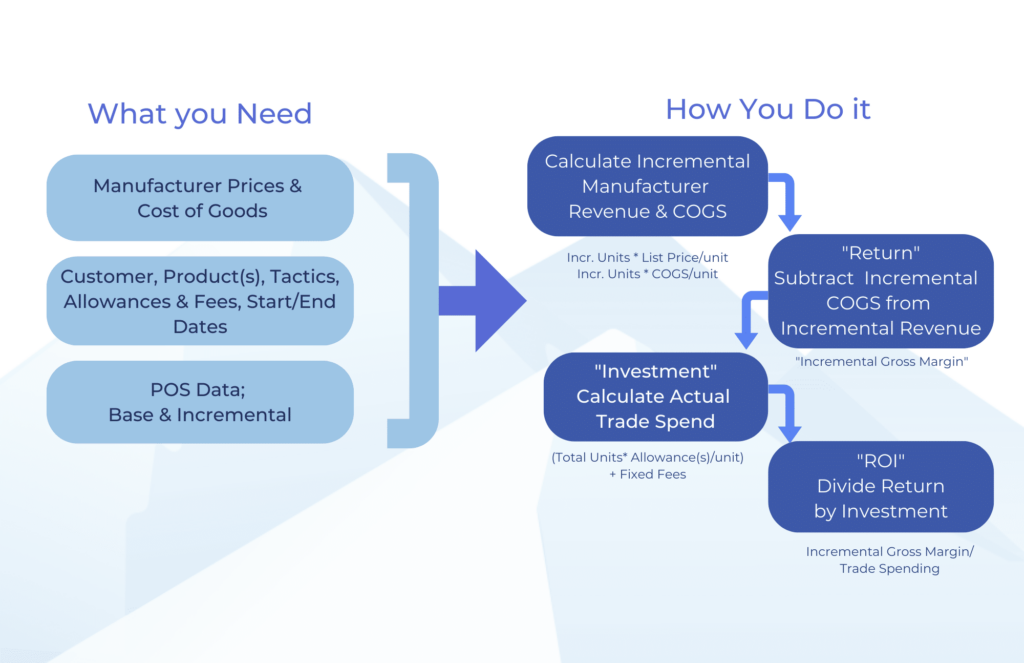
Trade promotion Return on Investment (ROI) is the most important key performance indicator in CPG/FMCG revenue management…but it is also one of the most inconsistently calculated metrics. Research from McKinsey & Company shows that 72% of US trade promotions fail to break even, yet most consumer goods brands cannot identify which 72% because they lack a consistent, reliable methodology for calculating the return on their promotional investment. BluePlanner, a component of the BlueRGM platform by UpClear automates promotional ROI calculation across the full portfolio, delivering an average 15%+ improvement in ROI within the first planning cycle.
Trade promotion ROI measures the incremental profit generated by a trade promotion relative to the cost of funding it. It is calculated as: Promotional ROI = Incremental Profit (the return)÷ Promotion Spending (the investment). A result above 1.0 means the promotion generated more in incremental profit than the trade investment required to fund it. A result below 1.0 means more money was spent to promote than the profit you earned for running the promotion. According to research by NielsenIQ, approximately 60% of CPG trade promotions globally generate a negative ROI, meaning the majority of trade investment in most portfolios is returning less than they cost. The goal of systematic ROI measurement is to identify which promotions belong to the profitable 40% and redirect investment accordingly.
ROI superior/inferior a 1 frente a un ROI negativo
While a ROI greater than 1 means your return was greater than the investment, a ROI less than 1 does mean there was a P&L loss during the promotional period.
The first decision in calculating trade promotion ROI is the volume type: sell-in (shipments from manufacturer to retailer) or sell-out (consumer purchases scanned at point of sale). Sell-out data, available from syndicated providers NielsenIQ, Circana, and SPINS, or directly from retailer EPOS systems, is the preferred basis because it measures the shopper response to the promotional offer. Sell-in data is distorted by the presence of existing inventory, or retailer forward-buying, where retailers purchase more product than they will sell during the promotion window. This will create a shipment spike that precedes the consumer promotional period by one to three weeks. BlueRGM by UpClear integrates sell-out data from NielsenIQ, Circana, and SPINS alongside sell-in data from ERP systems, including SAP, Microsoft, and Oracle, enabling accurate volume alignment for ROI calculation.
Base volume is sales when promotion tactics like price reductions, displays, and advertisements are not present. Base volume is required for ROI calculation because it is needed to calculate the “Return,” Incremental Profit. Three methods are used in practice: a store count multiplied by average weekly velocity (adjusted for seasonality); prior-year base sales from syndicated providers NielsenIQ or Circana, which typically provide base/incremental decomposition directly; or a statistically modelled baseline. To all of these methods, account-specific knowledge is added. This can include base volume adjustments attributable to distribution changes and changes to the everyday price. BlueRGM’s Account Planning capabilities support all three of these methods. The data science capability uses machine learning AI trained on historical sell-out data to produce the most turnkey d base volume in the most consistent way across customers and SKUs One of the most important factors to creating promotion ROI metrics that can be compared across customers is having a standard method for forecasting base volume. This ensures that the definition of ROI is consistent. Different definitions/methodologies for setting base volume across customers will skew results.
El volumen incremental es el volumen promocional total menos el volumen base; es decir, las unidades adicionales vendidas gracias a la promoción. El beneficio incremental se calcula entonces de la siguiente forma: volumen incremental × beneficio por unidad, donde el beneficio por unidad es igual al precio de venta neto del fabricante menos el coste de los productos vendidos (COGS). Utiliza el precio de venta del fabricante al minorista, no el precio al consumidor del minorista, y deduce cualquier descuento por «precio bajo todos los días» (EDLP) ofrecido al cliente. Por ejemplo: si el volumen de referencia es de 60 000 unidades, el volumen promocional total es de 100 000 unidades y el beneficio por unidad es de 0,92 $ (precio de venta neto de 2,30 $ menos el COGS de 1,38 $), entonces el beneficio incremental es igual a 40 000 × 0,92 $= 36 800$.
El gasto en promociones incluye todos los mecanismos de financiación vigentes durante el periodo promocional: bonificaciones por precio de venta habitual (EDLP), bonificaciones fuera de factura (OI), bonificaciones con reembolso posterior, bonificaciones por escaneo, comisiones publicitarias y comisiones por exposición. Se deben incluir todos los mecanismos: una promoción financiada tanto por una bonificación por escaneo como por una comisión publicitaria tiene un coste mayor que una financiada únicamente por una bonificación por escaneo. Excluir cualquier componente exagera sistemáticamente el retorno de la inversión (ROI) y hace que las comparaciones entre carteras sean poco fiables. Por ejemplo: un descuento por escaneo en 100 000 unidades a 0,15 $ = 15 000 $, más una tarifa de publicidad destacada de 5 000 $ = gasto total en promoción de 20 000$.
Divide incremental gross profit by total trade investment: $36,800 ÷ $20,000 = 1.84 (184%). This means the promotion generated $1.84of incremental profit for every $1.00 of trade investment, a strong result.. The ROI figure is only useful as a comparative metric, the methodology must be identical across every promotion in the portfolio for the numbers to be comparable. BlueRGM by UpClear applies a single, consistent ROI methodology to every promotion automatically, surfacing results in real-time dashboards in BlueRGM’s Reporting and Analytics without manual calculation or spreadsheet consolidation.

Kurt Kaiser es el director sénior de marketing de UpClear y cuenta con más de 30 años de experiencia en el sector de los bienes de consumo, con experiencia en gestión de cuentas, operaciones de ventas, marketing comercial y consultoría en RGM.
En UpClear, nuestra misión es ayudar a las marcas de bienes de consumo a maximizar sus ingresos y el rendimiento de sus inversiones comerciales mediante un software inteligente y colaborativo, que ofrece una única fuente de información fiable, una automatización optimizada e información útil para la toma de decisiones.
Blue RGM Intelligence Platform ofrece soporte para procesos de principio a fin, desde la planificación anual hasta la planificación de cuentas y la ejecución.