
Trade promotion Return on Investment (ROI) is the most important key performance indicator in CPG/FMCG revenue management…but it is also one of the most inconsistently calculated metrics. Research from McKinsey & Company shows that 72% of US trade promotions fail to break even, yet most consumer goods brands cannot identify which 72% because they lack a consistent, reliable methodology for calculating the return on their promotional investment. BluePlanner, a component of the BlueRGM platform by UpClear automates promotional ROI calculation across the full portfolio, delivering an average 15%+ improvement in ROI within the first planning cycle.
Trade promotion ROI measures the incremental profit generated by a trade promotion relative to the cost of funding it. It is calculated as: Promotional ROI = Incremental Profit (the return)÷ Promotion Spending (the investment). A result above 1.0 means the promotion generated more in incremental profit than the trade investment required to fund it. A result below 1.0 means more money was spent to promote than the profit you earned for running the promotion. According to research by NielsenIQ, approximately 60% of CPG trade promotions globally generate a negative ROI, meaning the majority of trade investment in most portfolios is returning less than they cost. The goal of systematic ROI measurement is to identify which promotions belong to the profitable 40% and redirect investment accordingly.
ROI Greater/Less than 1 vs. Negative ROI
While a ROI greater than 1 means your return was greater than the investment, a ROI less than 1 does mean there was a P&L loss during the promotional period.
The first decision in calculating trade promotion ROI is the volume type: sell-in (shipments from manufacturer to retailer) or sell-out (consumer purchases scanned at point of sale). Sell-out data, available from syndicated providers NielsenIQ, Circana, and SPINS, or directly from retailer EPOS systems, is the preferred basis because it measures the shopper response to the promotional offer. Sell-in data is distorted by the presence of existing inventory, or retailer forward-buying, where retailers purchase more product than they will sell during the promotion window. This will create a shipment spike that precedes the consumer promotional period by one to three weeks. BlueRGM by UpClear integrates sell-out data from NielsenIQ, Circana, and SPINS alongside sell-in data from ERP systems, including SAP, Microsoft, and Oracle, enabling accurate volume alignment for ROI calculation.
Base volume is sales when promotion tactics like price reductions, displays, and advertisements are not present. Base volume is required for ROI calculation because it is needed to calculate the “Return,” Incremental Profit. Three methods are used in practice: a store count multiplied by average weekly velocity (adjusted for seasonality); prior-year base sales from syndicated providers NielsenIQ or Circana, which typically provide base/incremental decomposition directly; or a statistically modelled baseline. To all of these methods, account-specific knowledge is added. This can include base volume adjustments attributable to distribution changes and changes to the everyday price. BlueRGM’s Account Planning capabilities support all three of these methods. The data science capability uses machine learning AI trained on historical sell-out data to produce the most turnkey d base volume in the most consistent way across customers and SKUs One of the most important factors to creating promotion ROI metrics that can be compared across customers is having a standard method for forecasting base volume. This ensures that the definition of ROI is consistent. Different definitions/methodologies for setting base volume across customers will skew results.
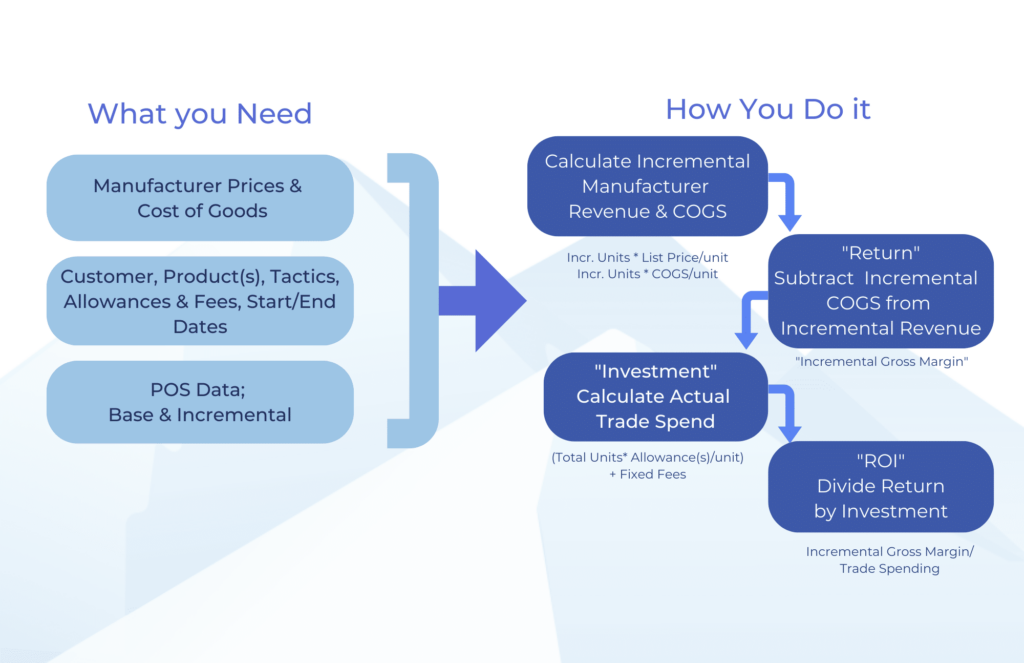
Incremental volume is total promotional volume minus base volume; the additional units sold because the promotion happened. Incremental profit is then calculated as: Incremental Volume × Profit Per Unit, where profit per unit equals the manufacturer’s net selling price minus cost of goods sold (COGS). Use the manufacturer’s selling price to the retailer, not the retailer’s consumer price, and net of any everyday low price (EDLP) allowances offered to the customer. E.g. : if baseline volume is 60,000 units, total promotional volume is 100,000 units, and profit per unit is $0.92 (net selling price $2.30 minus COGS $1.38), then incremental profit equals 40,000 × $0.92 = $36,800.
Promotion spending includes every funding vehicle in place during the promoted period: EDLP allowances, off-invoice allowances (OI), billback allowances, scan-back allowances, advertising fees, and display fees. Include all vehicles- a promotion funded by both a scan allowance and a feature advertising fee has a higher cost than one funded only by a scan allowance. Excluding any component systematically overstates the ROI and makes portfolio comparisons unreliable. E.g. : scan allowance on 100,000 units at $0.15 = $15,000, plus feature advertising fee $5,000 = total promotion spending of $20,000.
Divide incremental gross profit by total trade investment: $36,800 ÷ $20,000 = 1.84 (184%). This means the promotion generated $1.84of incremental profit for every $1.00 of trade investment, a strong result.. The ROI figure is only useful as a comparative metric, the methodology must be identical across every promotion in the portfolio for the numbers to be comparable. BlueRGM by UpClear applies a single, consistent ROI methodology to every promotion automatically, surfacing results in real-time dashboards in BlueRGM’s Reporting and Analytics without manual calculation or spreadsheet consolidation.
Kurt Kaiser is the Senior Director of Marketing at UpClear and has over 30 years years of experience in Consumer Goods with experience in account sales, sales operations, trade marketing, & RGM consulting
At UpClear, our mission is to empower Consumer Goods brands to maximize revenue performance and trade investment returns through intelligent, collaborative software—providing a single source of truth, streamlined automation, and actionable insights.
The Blue RGM Intelligence Platform supports end-to-end processes, from Annual Planning to Account Planning and Execution.