Why Building Your CPG/FMCG Trade Data to Mirror the Finance P&L Is a Mistake
July 27th, 2026
How to Structure Your CPG/FMCG Trade System to Work Across Teams
Building a CPG/FMCG trade system is a deceptively difficult undertaking. Sales, trade marketing, finance, and operations all have a stake in how it’s set up. For that reason, they each get involved at different points in the process, with different priorities and different ideas about what the system should do.
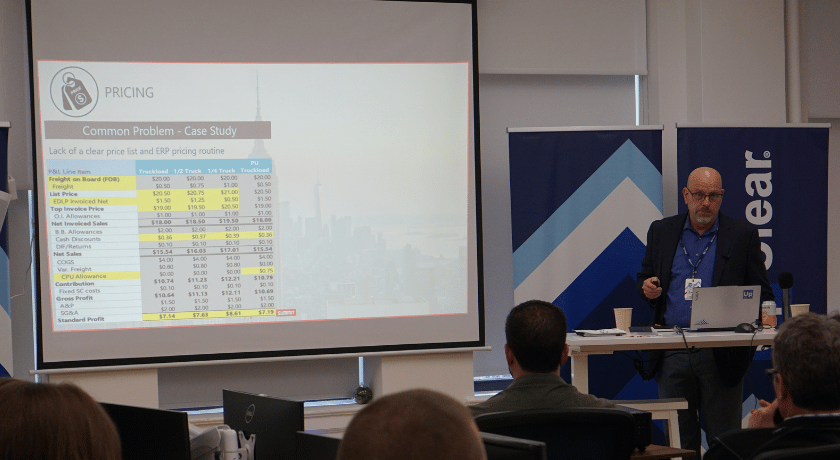
However, to make one system work for all of them tends to result in a Frankenstein system that doesn’t fully serve anyone. At UpClear’s 2026 CPG Data Summit in New York, Don Baker of The Partnering Group identified one mistake he sees repeatedly across his clients: building the trade system to mirror the Finance P&L.
In theory, this setup makes it easier to build reports and conduct analysis at the end of each reporting period. In practice, it produces a tool that salespeople find hard to use and leaves RGM teams without the data they actually need.
To avoid this undesirable outcome, it helps to understand how finance data and trade data differ, what questions you need to answer for an effective trade promotion experience (TPx), and how to structure your data so different teams can work from the same source.
Finance Data and Trade Data Are Not the Same Thing
The Finance P&L is structured around how a company books money internally to measure overall performance and profitability. It focuses on big-picture metrics like gross revenue, net sales, gross profit, and Earnings Before Interest & Taxes (EBIT). It’s typically organized by accounting category, and it’s designed to answer a specific set of questions: how much did we sell? What did it cost us?, What did we make (or lose)?
It’s the right data for what finance needs to do: report results, manage accruals, and ensure the numbers hold up to audit.
While trade teams use a lot of same KPIs and metrics in their work, their data needs to be structured around how they do business with customers. When a salesperson sits down to plan a promotion at Walmart, they’re thinking about practical components. That may include promotion tactics (display, feature, price reductions), EDLP allowances, freight fines and fees. These won’t show up in P&L line items; rather, they’re the language of a contract and a customer relationship.
The problem: Not all P&L items are expressed in customer language, and not all customer arrangements map cleanly to the general ledger. When you collapse those two things into a single structure, you get a system that serves neither audience well.
The Problem of Hidden Trade Investments
Baker brought up a common example he sees with clients: “If an item’s price is $10 and they need to give it to Walmart at $8, some brands go right into the ERP and price the item $8.”
“Then when you ask them what their trade spend is at Walmart…oh, it’s great. We’re 5% and everybody else is at 25%. Well… that’s because you’re hiding $2 of discounts in the price of the product.”
When trade investment is hidden in pricing, companies often don’t understand the scale of what they’re giving away. Terms that were absorbed into price over time are rarely documented in a defensible way, creating commercial exposure.
In M&A situations, the absence of clearly structured and visible trade terms also becomes a liability. A new buyer inherits an undocumented discount, and an acquiring company can’t assess the trade liability. Pricing catered to one competitive context gets locked in, since the documentation doesn’t tell the full story.
These mistakes can go unnoticed for a long time. That’s because the data looks clean, but it misrepresents the key metrics that go into decision making, such as trade spend investment and sales lifts.
The Questions Each Team Is Trying To Answer
A clean, well-structured system means nothing if it isn’t giving teams the information they can actually use. To start, you need to think about what questions your data needs to answer for each team.
Finance wants to know:
What are our liabilities?
How conservative do we need to be on accruals?
How are we going to pass the audit?
To add, their scope is the entire enterprise, not just customer sales and spending.
What are the trade-offs I can bring back to the table in a negotiation?
RGM wants to know:
How are we performing vs. budget?
Are we on-track with target?
What is our forecast/latest estimate?
What can we do in-year to improve our performance?
While these questions can be answered using the same data, they require that data to be structured differently, and at varying levels of granularity.
Finance typically books accruals at the brand or customer level, with a bucket by month. However, a good trade system provides granularity at the customer-and-product level. When those two systems are forced to stay in sync, you lose the detail that makes the trade system useful in the first place.
How To Structure Your Data for Effective Cross-Team Collaboration
At UpClear’s Spring 2026 London RGM Summit, Simon-Kucher research from roughly 100 UK and European companies found that only 30% report strong cross-functional coordination. A critical element of improving this collaboration is facilitation of each team’s needs with one, unified source of data.
This means starting with business drivers, or the levers to get the customer to the shelf and drive sales. That could include displays, features, a price reduction, an EDLP allowance, damage allowances, freight discounts, or retail media programs.
These should be the planning inputs in the trade system because they’re the language your team works in during execution tasks.
For instance, if the deduction says “feature allowance” and the trade system has a line called “below-the-line promotional spend,” accounts receivable won’t be able to match the backup to review or resolve it.
Once your system is mapped at a granular level, those business drivers can get mapped to general ledger (GL) lines in the background as a downstream input. This preserves the granularity the sales team needs to plan and the RGM team needs to measure. At the same time, it provides finance the GL mapping they need to book it correctly.
Building a System That Works for You
A trade system isn’t a financial reporting tool. Finance should absolutely have visibility into what’s in it, and the numbers should reconcile. However, if the system is built around the P&L from the start, the salesperson is navigating a finance report to plan a promotion. In the end, you’ll get exactly the level of engagement and data quality that implies.
The goal is to have a system that salespeople use, that finance can trust, and that RGM can learn from. Those three things can coexist; they just require building the structure in the right order.
“The goal is to have a system that salespeople use, that finance can trust, and that RGM can learn from.”
How the Blue RGM Intelligence Platform Supports Better Trade Data
When setting out to rework your trade system, you’ll need to start with a strong RGM solution to support your transition. UpClear’s Blue RGM Intelligence platform— with TPM, TPO, and RGM capabilities— is designed specifically for CPG and FMCG brands that need their trade, finance, and demand planning functions working from the same data, structured in a way that serves all of them.
Blue RGM is organized around three interconnected solution sets:
Compass: Annual planning – set up top-down targets, establish promotional guidelines, and run scenario planning
Planner: Account-level planning – organize assortment, pricing, terms, volumes, and promotion calendars
Bridge: Execution – connecting sales work to Finance, Accounting, and Demand Planning work: accrual forecasting, deduction management, consensus forecasting
Underpinning all of this is a unified database that gives every function access to the same customer data, from targets and forecasts through to actuals. This shared foundation enables cross-functional coordination without forcing every team to work in the same structure.
FAQs
Why shouldn’t your CPG/FMCG trade system mirror the Finance P&L?
The P&L is built to answer finance’s questions— what did we sell, what did it cost, what did we make. This is organized by accounting category at the brand or customer level. Trade decisions happen at a different altitude. A salesperson planning a Walmart promotion is thinking in terms of displays, EDLP allowances, and freight fees, not GL line items. Without that visibility, salespeople are left with an incomplete picture of ROI. They can’t accurately track their total trade investment, assess customer or portfolio profitability, or proactively manage spend before it becomes a problem.
What happens if you don’t separate CPG/FMCG trade data from finance data?
Consolidating your data can result in insights obscured by over-generalization. For instance, discounts may get buried in the ERP price instead of tracked as trade spend. If a $10 item is priced at $8 for Walmart directly in the system, your reported trade spend looks artificially low—say 5% instead of the real 25%—because $2 of discount is hidden in the price rather than recorded as investment. This kind of error can go unnoticed for a long time, leading to misinformed decisions.
How should you structure CPG/FMCG data so it works for sales, finance, and RGM?
Start with investment levers (displays, features, price reductions, EDLP allowances, damage/freight allowances, retail media). These become the planning inputs, captured in the language teams actually use during execution. From there, each driver maps downstream to the appropriate GL line in the background. That preserves the granularity sales needs to plan and RGM needs to measure. At the same time, it still gives finance a clean path to book everything correctly.
How does UpClear’s Blue RGM Intelligence platform support an effective trade system and P&L structure for CPG/FMCG brands?
Blue RGM is built around three connected solution sets— Compass for annual planning, Planner for account-level planning, and Bridge for execution)—all running on a single unified database. That shared foundation gives sales, finance, and RGM access to the same targets, forecasts, and actuals without forcing everyone into one rigid structure. As a result, each team gets the view and granularity it needs.
That means less time spent debating how the numbers break down and more insights from the data. Forecasts get sharper, trade investment gets more defensible, and the gap between planned and actuals shrinks over time.
About UpClear
UpClear is a software company and maker of Blue, an intelligence platform used by Consumer Goods brands. We deliver a holistic Revenue Growth Management solution, including capabilities for TPM, TPO, IBP, and RGM. Our mission is to empower brands to maximize revenue performance and trade investment returns through intelligent, collaborative software— providing a single source of truth, streamlined automation, and actionable insights.