
BENCHMARK REPORT
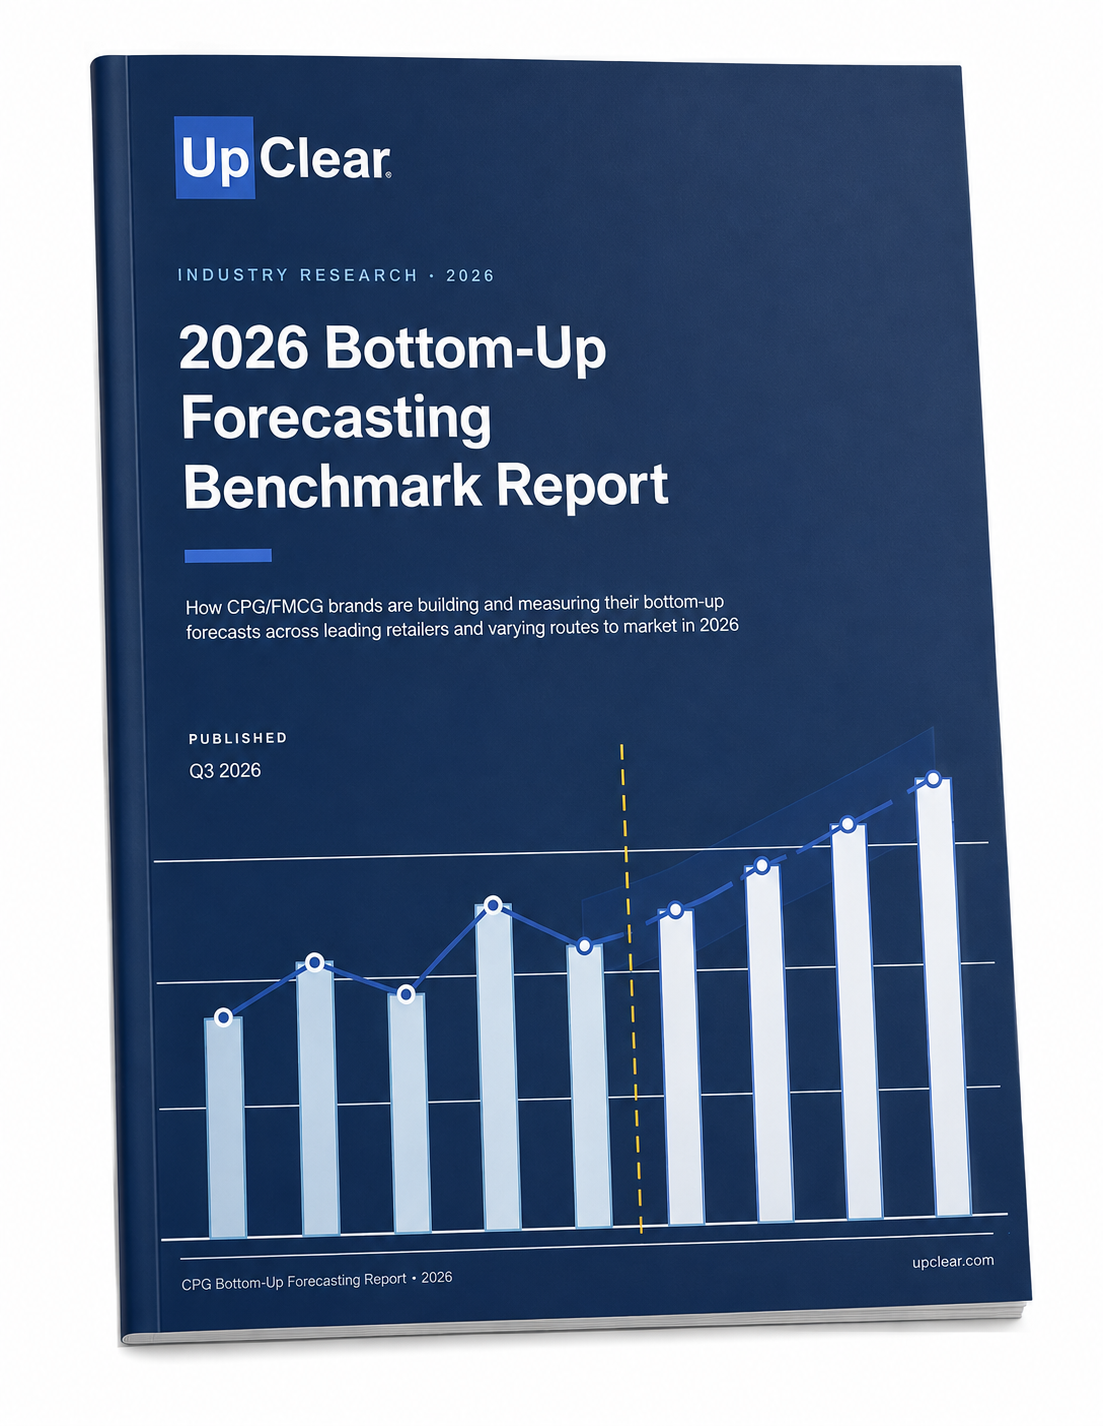
Bottom-Up Sales Forecasting in CPG: 2026 Practices
The State of Bottom-Up Forecasting for Mid-Market CPG Brands
Bottom-up forecasting is a key part of the financial and demand planning process, capturing account-level details that won't come up in high-level targets. We surveyed customer teams at top CPG/FMCG brands to benchmark how they build, manage, and improve their customer forecasts.
Building Bottom-Up Forecasts in 2026
HOW BASE VOLUME IS FORECASTED (% OF PARTICIPANTS)
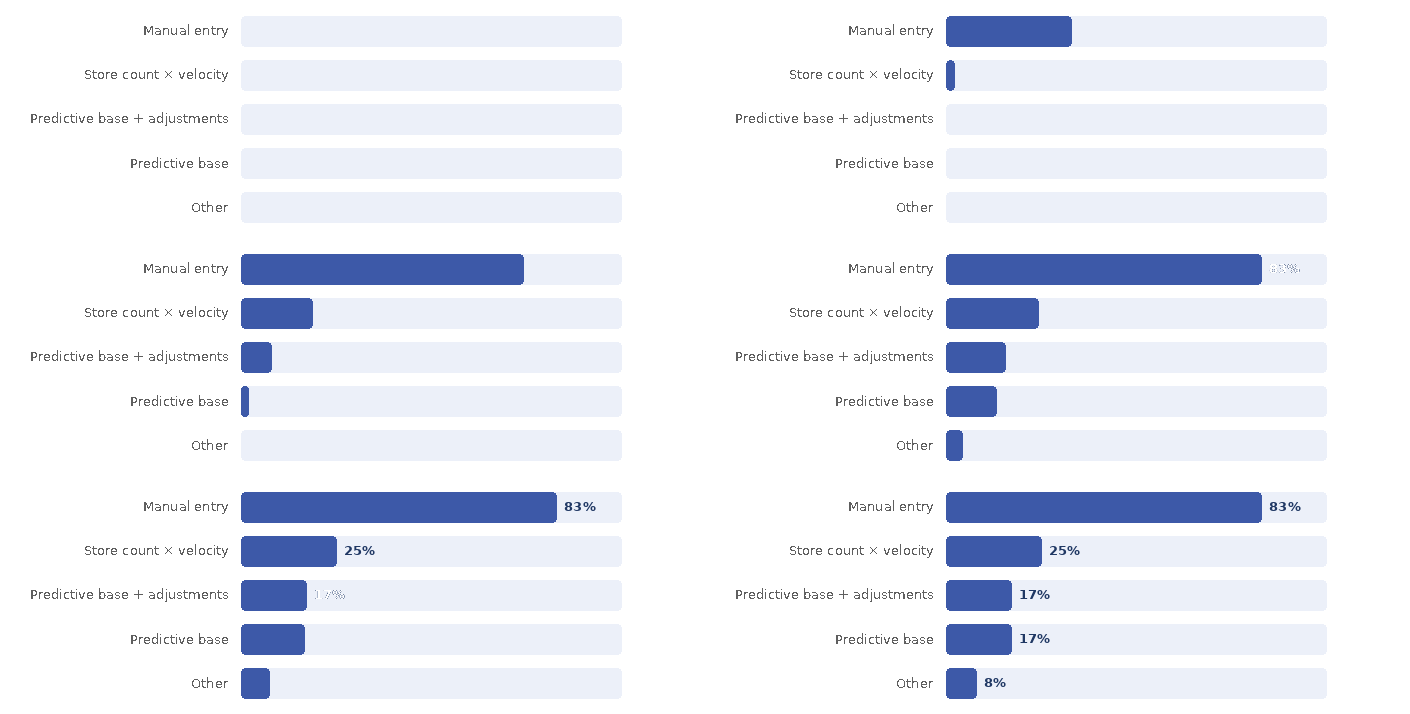
HOW PROMOTIONAL UPLIFT IS FORECASTED (% OF PARTICIPANTS)

What's Inside?
01
How Forecasts Are Built
Tools, methods, and cadence. How customer teams actually create bottom-up forecasts — and what manual-only really means in practice.
02
Retailer Coverage and Granularity
Which accounts get forecasted, at what product level, and how teams handle retailers supplied by distributors.
03
Data Integration and Actuals
How teams integrate shipment, distributor, and consumption actuals — and what data is missing from most forecasting processes.
04
Team Sentiment
Perceptions around bottom-up forecast accuracy, team confidence levels, and how sentiment has changed over time.
05
Accountability and Training
Ownership of the forecast process, how accountability is structured, and how well customer teams are equipped to execute.
06
Recommendations
Practical next steps for CPG teams looking to strength the bottom-up forecasting process moving forward.
Uncover How Your CPG Peers Are Building Bottom-Up Forecasts
📊 Benchmark Your Forecasting Process
See how your team's methods, tools, and cadence compare to commercial planning practitioners across CPG and FMCG.
🔍 See Where the Process Breaks Down
Understand where manual methods, data gaps, and inconsistent uplift approaches compound into bigger problems over time.
📋 Gauge the Industry Standard
See how teams structure retailer coverage, update frequency, accuracy measurement, and accountability at the ground level.
🎯 Build a Stronger Forecasting Foundation
Walk away with practical recommendations for improving how your team builds, validates, and takes ownership of account forecasts.
Key Insights
100%
of CPG teams rely on manual forecasting in at least part of their process
-75
overall NPS for customer team forecast quality
17%
of CPG teams don't measure forecast accuracy at all
83%
of CPG teams forecast at the SKU level
FAQs
Bottom-up sales forecasting is the process of building a sales forecast at the customer or account level and rolling those forecasts upward into a total volume picture. In contrast to top-down planning, it captures the account-specific context that aggregate forecasts miss, including promotional calendars, ranging decisions, distribution changes, and buyer-level dynamics.
Top-down forecasting starts with a total revenue or volume target, often set by finance or leadership, and allocates it down to markets, channels, or customers. Bottom-up forecasting requires someone, typically a sales or trade marketing manager, to build a forecast for each account based on their knowledge of that account's plans and behavior.
Base volume is the quantity a retailer would be expected to sell at regular shelf price, without any promotional activity. Promotional uplift is the incremental volume driven by promotions, including price reductions, feature and display, or temporary price reductions (TPRs).
According to UpClear's Bottom-Up Forecasting Report, Mean Absolute Percentage Error (MAPE) is the primary methodology for measuring bottom-up forecast accuracy. The survey found that 50% of respondents used MAPE, 25% used WAPE, and 25% used an actuals-to-forecast ratio.
It's written for CPG professionals who build and use account-level forecasts: Sales Directors, Trade Marketing Managers, RGM leads, Demand Planning teams, and the Finance partners who work alongside them. It's also useful for commercial leaders who want to understand where the process is breaking down before investing in tools or training.